Urban waste management remains a critical challenge for the development of smart cities. Despite the growing number of litter detection datasets, the problem of monitoring overflowing waste containers, particularly from images captured by garbage trucks, has received little attention. While existing datasets are valuable, they often lack annotations for specific container tracking or are captured in static, decontextualized environments, limiting their utility for real-world logistics. To address this gap, we present StreetView-Waste, a comprehensive dataset of urban scenes featuring litter and waste containers. The dataset supports three key evaluation tasks: (1) waste container detection, (2) waste container tracking, and (3) waste overflow segmentation. Alongside the dataset, we provide baselines for each task by benchmarking state-of-the-art models in object detection, tracking, and segmentation. Additionally, we enhance baseline performance by proposing two complementary strategies: a heuristic-based method for improved waste container tracking and a model-agnostic framework that leverages geometric priors to refine litter segmentation. Our experimental results show that while fine-tuned object detectors achieve reasonable performance in detecting waste containers, baseline tracking methods struggle to accurately estimate their number; however, our proposed heuristics reduce the mean absolute counting error by 79.6%. Similarly, while segmenting amorphous litter is challenging, our geometry-aware strategy improves segmentation mAP@0.5 by 27% on lightweight models, demonstrating the value of multimodal inputs for this task. Ultimately, StreetView-Waste provides a challenging benchmark to encourage research into real-world perception systems for urban waste management.
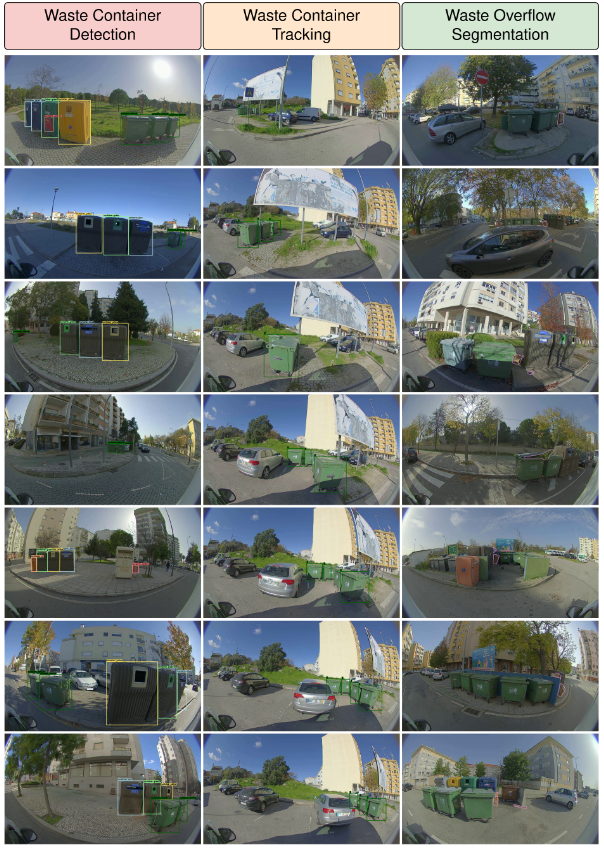
This task provides a large-scale benchmark for detecting seven classes of waste containers. The dataset is designed to test model robustness in diverse urban scenes captured from a moving vehicle.
Download Detection DataThis task focuses on the challenge of associating container detections across frames. It includes dense annotations with unique IDs, enabling the evaluation of tracking performance on real-world challenges like occlusion.
Download Tracking DataThis task aims to produce pixel-accurate masks for unstructured waste spilling from containers. The dataset subset for this task is balanced to facilitate fair model training and evaluation.
Download Segmentation Data
To improve tracking and counting, we introduce a set of heuristic rules applied as a post-processing step. These include a minimum track duration filter to remove noisy, short-lived tracks; a temporal merging rule to reconnect tracks fragmented by brief occlusions; and a spatial proximity constraint to ensure that merged tracks correspond to the same physical object.
To tackle the challenging task of segmenting amorphous overflowing waste, we propose a model-agnostic strategy that enriches the standard RGB input. We use a zero-shot model to infer depth and surface normal maps, which are then concatenated with the RGB image to form a 7-channel input tensor. This additional geometric information helps models better distinguish foreground waste from cluttered backgrounds.
| Class | DiffusionVID | YOLOv11 | ||||
|---|---|---|---|---|---|---|
| AP@0.5 | AP@[.5:.95] | AR@[.5:.95] | AP@0.5 | AP@[.5:.95] | AR@[.5:.95] | |
| Default Container | 0.96±0.02 | 0.75±0.03 | 0.78±0.03 | 0.98±0.01 | 0.82±0.02 | 0.82±0.02 |
| Green Container | 0.92±0.03 | 0.76±0.03 | 0.82±0.03 | 0.97±0.02 | 0.82±0.03 | 0.84±0.02 |
| Biodegradable Container | 0.92±0.02 | 0.75±0.02 | 0.77±0.03 | 0.96±0.01 | 0.85±0.02 | 0.86±0.02 |
| Blue Container | 0.95±0.02 | 0.73±0.03 | 0.79±0.03 | 0.96±0.02 | 0.80±0.02 | 0.81±0.02 |
| Yellow Container | 0.90±0.03 | 0.73±0.03 | 0.80±0.03 | 0.96±0.01 | 0.82±0.02 | 0.84±0.02 |
| Oil Container | 0.92±0.02 | 0.62±0.04 | 0.69±0.04 | 0.93±0.01 | 0.70±0.03 | 0.70±0.03 |
| Battery Container | 0.82±0.05 | 0.57±0.05 | 0.61±0.05 | 0.80±0.06 | 0.61±0.05 | 0.55±0.05 |
| All Classes | 0.91±0.03 | 0.70±0.03 | 0.76±0.03 | 0.94±0.02 | 0.77±0.03 | 0.77±0.03 |
We report AP@0.5, AP@[0.5:0.95], and AR@[0.5:0.95] (mean ± std). YOLOv11 outperforms DiffusionVID overall, with DiffusionVID being stronger on Battery containers.
Tracking Accuracy
| Model | Experiment | MOTA↑ | IDF1↑ | HOTA↑ | DetA↑ | AssA↑ |
|---|---|---|---|---|---|---|
| ByteTrack | Baseline | 76.80% | 81.40% | 69.76% | 69.96% | 69.83% |
| H₁ (Duration) | 77.10% | 82.20% | 69.73% | 69.30% | 70.40% | |
| H₁+H₂ (Temporal) | 77.00% | 55.10% | 50.98% | 45.62% | 57.03% | |
| H₁+H₂+H₃ (Spatial) | 77.20% | 66.80% | 59.60% | 56.35% | 63.15% | |
| BoT-SORT | Baseline | 82.50% | 79.60% | 71.50% | 75.27% | 68.17% |
| H₁ (Duration) | 82.40% | 82.10% | 72.09% | 73.80% | 70.61% | |
| H₁+H₂ (Temporal) | 82.50% | 75.80% | 67.34% | 65.82% | 69.06% | |
| H₁+H₂+H₃ (Spatial) | 82.50% | 79.80% | 70.30% | 70.69% | 70.06% |
Counting Accuracy
| Model | Experiment | MAE↓ | SAD↓ | RMSE↓ | MAPE↓ |
|---|---|---|---|---|---|
| ByteTrack | Baseline | 3.48 | 73 | 7.80 | 82.96% |
| H₁ (Duration) | 1.05 | 22 | 1.93 | 24.96% | |
| H₁+H₂ (Temporal) | 0.76 | 16 | 1.75 | 17.77% | |
| H₁+H₂+H₃ (Spatial) | 0.71 | 15 | 1.70 | 16.03% | |
| BoT-SORT | Baseline | 6.43 | 135 | 9.60 | 187.61% |
| H₁ (Duration) | 1.19 | 25 | 1.91 | 27.19% | |
| H₁+H₂ (Temporal) | 0.81 | 17 | 1.36 | 16.03% | |
| H₁+H₂+H₃ (Spatial) | 0.90 | 19 | 1.79 | 17.96% |
We report tracking metrics (MOTA/IDF1/HOTA/DetA/AssA) and counting metrics (MAE/SAD/RMSE/MAPE) for ByteTrack and BoT-SORT with progressive heuristics.
| Model | Experiment | mAP@0.5 | mAP@[0.5:0.95] | B-IoU |
|---|---|---|---|---|
| YOLOv11 | Baseline (RGB) | 0.50±0.01 | 0.30±0.01 | 0.77±0.01 |
| Ours (Geometric Cues) | 0.52±0.01 | 0.31±0.01 | 0.77±0.01 | |
| YOLACT | Baseline (RGB) | 0.41±0.02 | 0.22±0.01 | 0.87±0.02 |
| Ours (Geometric Cues) | 0.52±0.02 | 0.31±0.02 | 0.90±0.01 | |
| Mask2Former | Baseline (RGB) | 0.18±0.02 | 0.11±0.01 | 0.38±0.02 |
| Ours (Geometric Cues) | 0.29±0.02 | 0.13±0.01 | 0.32±0.02 | |
| Mask R-CNN | Baseline (RGB) | 0.41±0.02 | 0.26±0.01 | 0.54±0.02 |
| Ours (Geometric Cues) | 0.12±0.01 | 0.06±0.01 | 0.38±0.01 | |
| SOLOv2 | Baseline (RGB) | 0.20±0.03 | 0.10±0.01 | 0.30±0.02 |
| Ours (Geometric Cues) | 0.07±0.01 | 0.03±0.00 | 0.20±0.01 |
We report mAP@0.5, mAP@[0.5:0.95], and boundary IoU (B-IoU) for overflow segmentation (mean ± std).
@inproceedings{paulo2025streetviewwastemultitaskdataseturban,
  title={{StreetView-Waste: A Multi-Task Dataset for Urban Waste Management}},
  author={Diogo J. Paulo, João Martins, Hugo Proença and João C. Neves},
  booktitle={Proceedings of the IEEE/CVF Winter Conference on Applications of Computer Vision (WACV)},
  year={2025}
}
© This webpage was in part inspired from this template.